
Greater Kansas City Housing Market Snapshot: October 2026
How is the Kansas City housing market in October 2026?
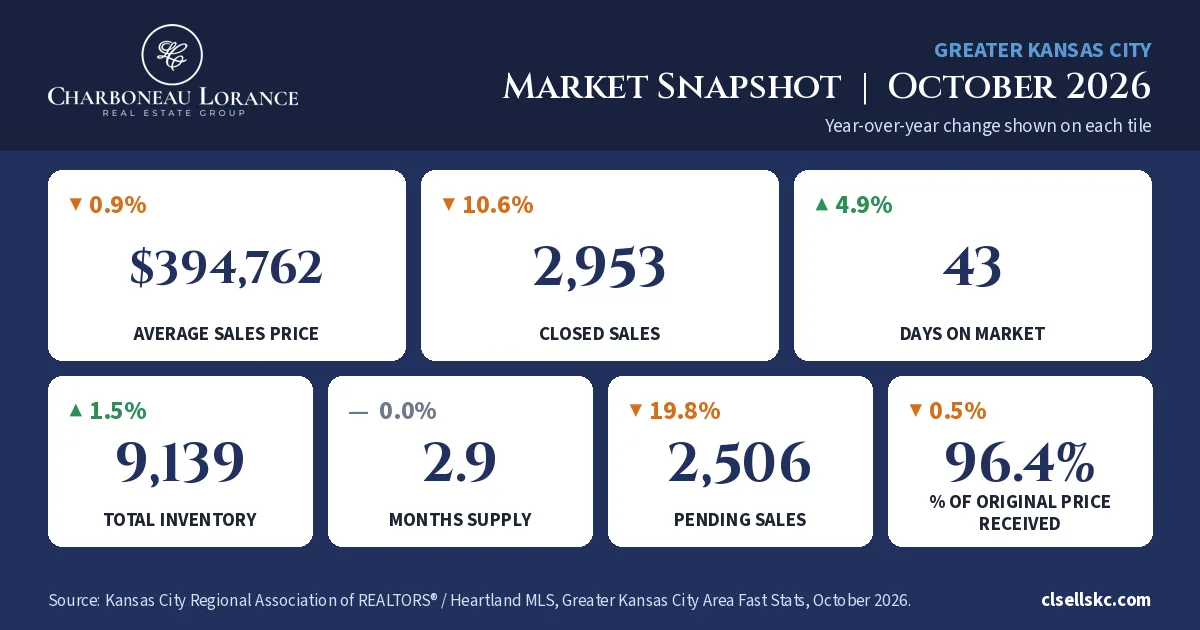
Short answer: In October 2026, the average sales price across the Greater Kansas City area was $394,762, down 0.9% from a year earlier. There were 2,953 closed sales (down 10.6% year over year), homes spent 43 days on the market, and the market had 2.9 months of supply. County results varied: Johnson County, Kansas, stayed the tightest, at 2.3 months of supply, while Cass County, Missouri, had 3.4 months.
The numbers
| Measure | October 2026 | Change from a year earlier |
|---|---|---|
| Average sales price | $394,762 | -0.9% |
| Closed sales | 2,953 | -10.6% |
| Pending sales | 2,506 | -19.8% |
| Days on market | 43 | +4.9% |
| Total inventory | 9,139 | +1.5% |
| Months supply | 2.9 | 0.0% |
| Percentage of original price received | 96.4% | -0.5% |
Source: Kansas City Regional Association of REALTORS® (KCRAR) and Heartland MLS, Greater Kansas City Area Fast Stats, October 2026. These figures cover the whole Greater Kansas City area, not a single city or neighborhood, and the price shown is the average sales price, not the median. The metro Local Market Update reports the same combined numbers, plus a median sales price of $330,000 (unchanged from a year earlier).
How the five counties compared
Johnson County, KS and Johnson County, MO (Warrensburg) are two different markets. Year-over-year change is shown next to each figure. See each county section below, or our county market pages, for the full set of measures.
| County | Average price | Median price | Closed sales | Months supply |
|---|---|---|---|---|
| Jackson County, MO | $342,042 (+4.3%) | $290,000 (+5.5%) | 738 (-18.1%) | 3.1 (+6.9%) |
| Johnson County, KS | $569,817 (-3.3%) | $452,500 (-2.7%) | 736 (-14.4%) | 2.3 (-4.2%) |
| Cass County, MO | $435,833 (+0.7%) | $323,750 (-8.0%) | 140 (-6.0%) | 3.4 (+25.9%) |
| Clay County, MO | $375,061 (-2.2%) | $331,500 (-1.3%) | 288 (-11.4%) | 2.2 (-12.0%) |
| Johnson County, MO (Warrensburg) | $358,278 (+6.2%) | $347,950 (+12.2%) | 60 (+27.7%) | 3.1 (-13.9%) |
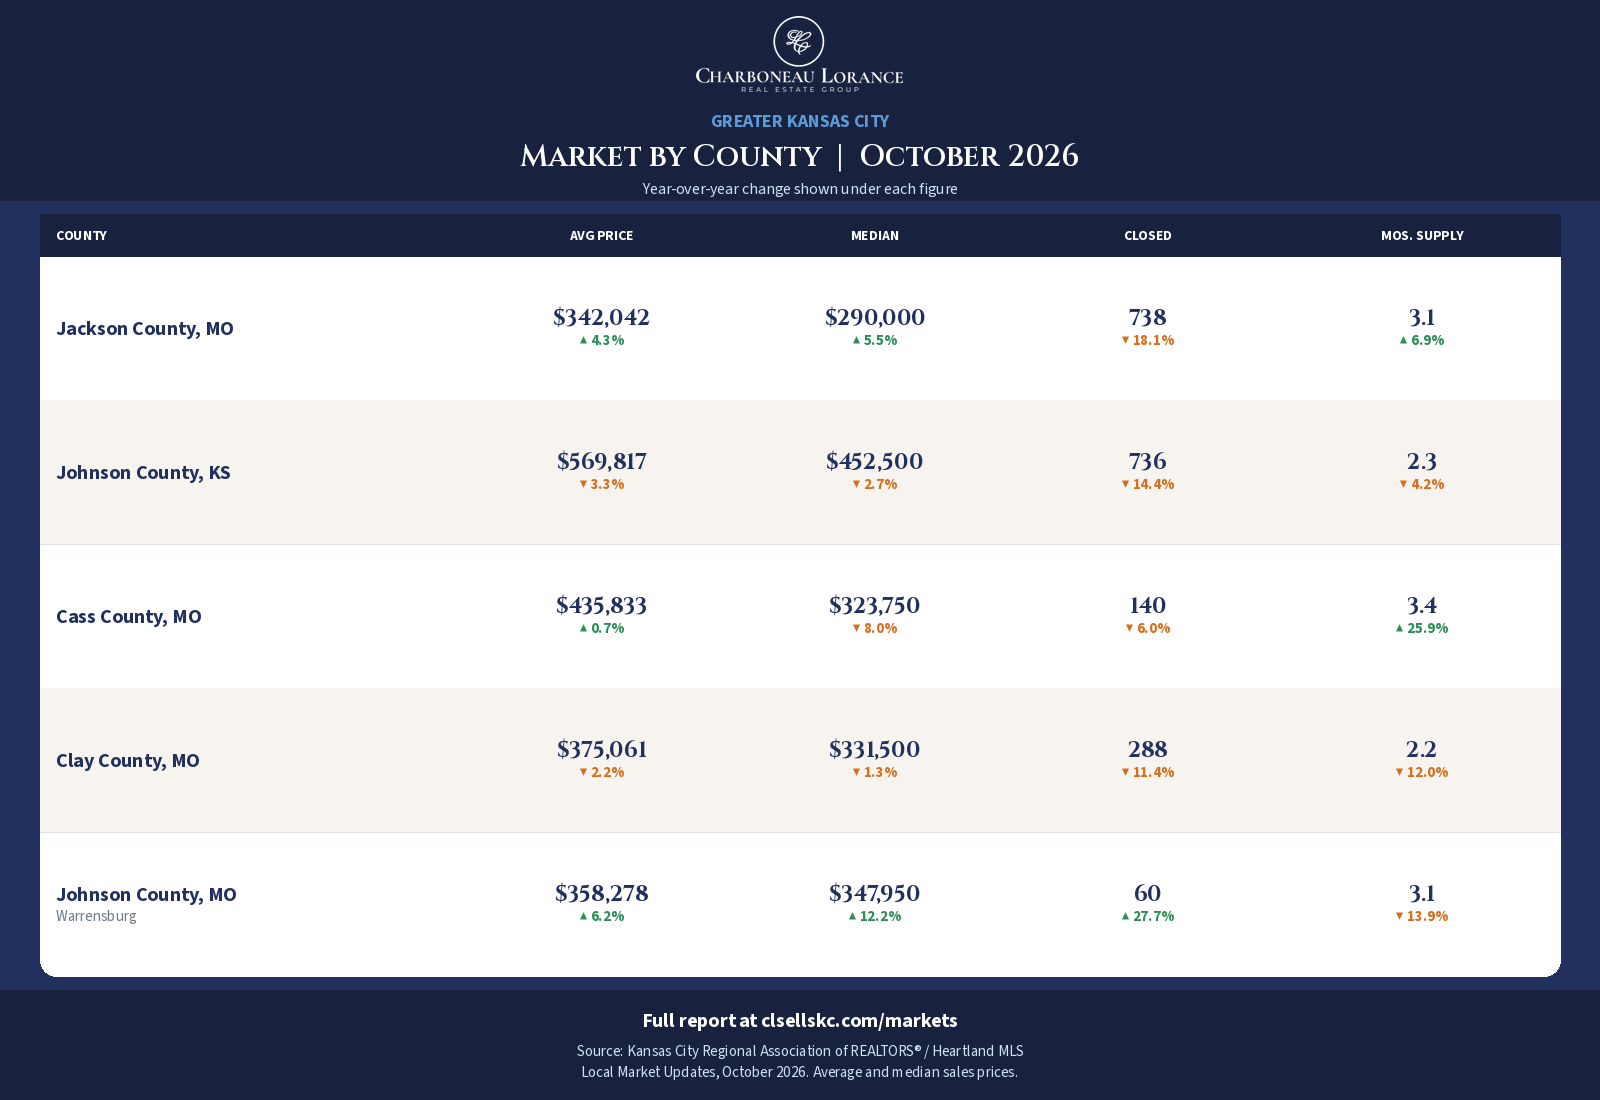
Source: KCRAR / Heartland MLS Local Market Updates for October 2026, current as of November 7, 2026. Dated report links are in each county section below.
What does it mean?
At 2.9 months of supply, the Greater Kansas City market still leans toward sellers. A market is generally considered balanced at around six months of supply. Sellers received 96.4% of their original list price, and total inventory was 9,139 homes.
Fewer homes went under contract this October than a year ago, with pending sales down 19.8%. That is worth watching as we head into winter.
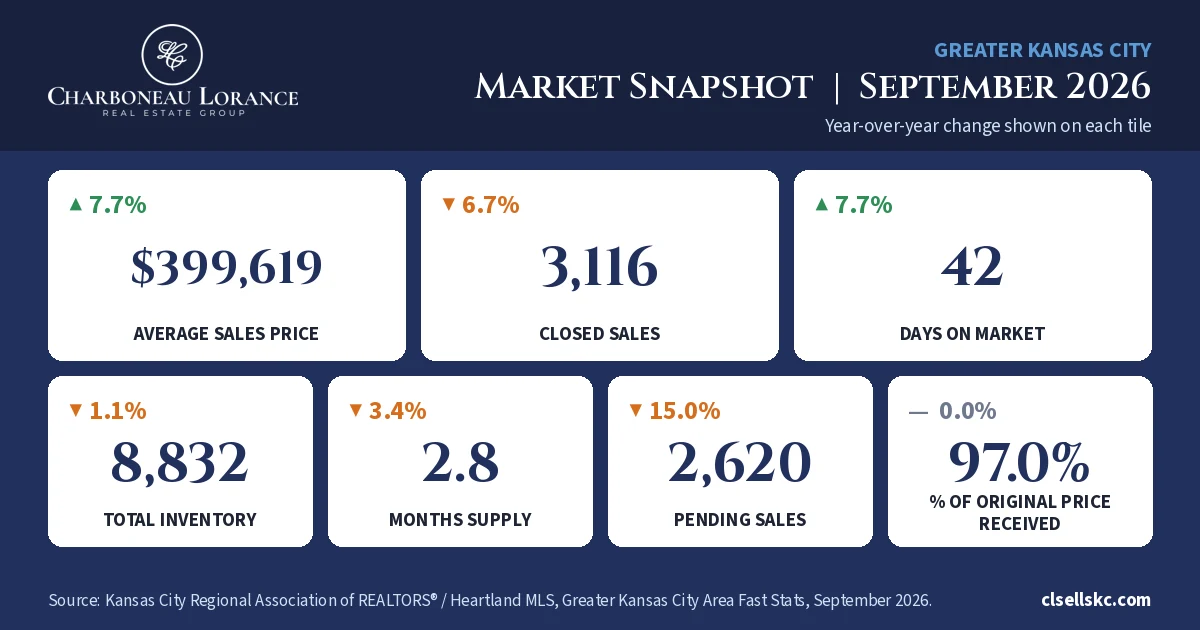
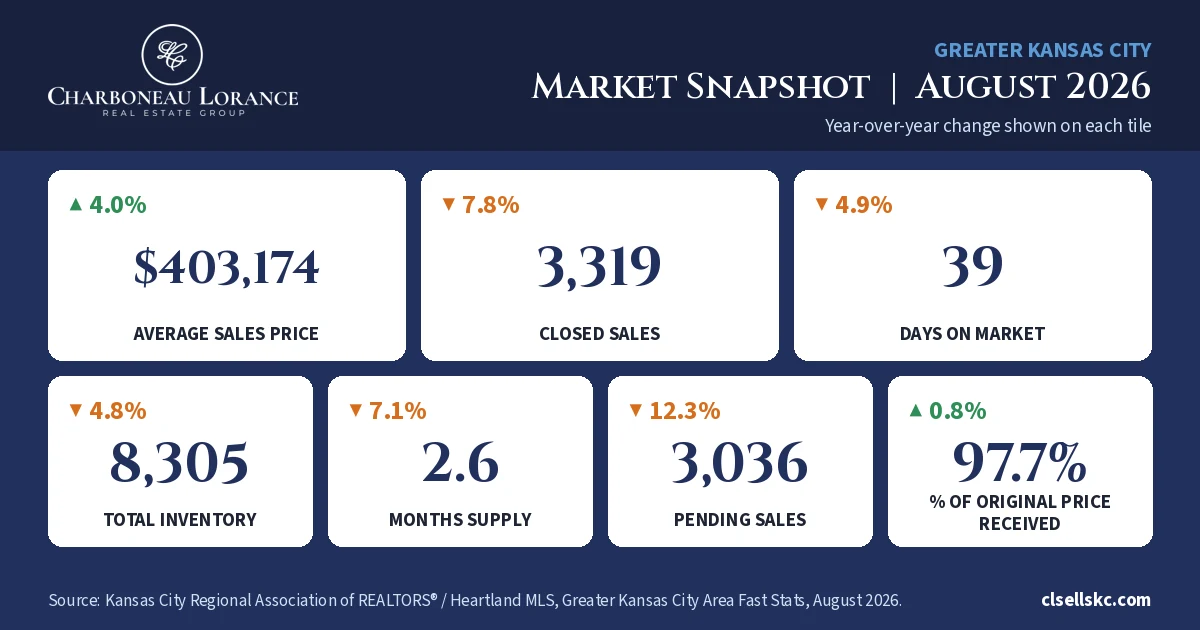
Compared with September: the average sales price moved from $399,619 to $394,762, and days on market went from 42 to 43.
The metro average hides some important local differences, which is why we also publish county-by-county pages each month.
Jackson County, MO Housing Market – October 2026
In October, Jackson County homes sold for an average of $342,042, up 4.3% from a year earlier, even as closed sales fell 18.1% to 738. Homes took 46 days to sell, and supply edged up to 3.1 months. That’s a slower pace than last fall, but prices in our backyard — Lee’s Summit, Blue Springs, Independence and the rest of the county — held up.
| Measure | October 2026 | Change from a year earlier |
|---|---|---|
| Average sales price | $342,042 | +4.3% |
| Median sales price | $290,000 | +5.5% |
| Closed sales | 738 | -18.1% |
| Pending sales | 677 | -20.7% |
| Days on market | 46 | +21.1% |
| Total inventory | 2,536 | +1.5% |
| Months supply | 3.1 | +6.9% |
| Percentage of original price received | 96.0% | -0.6% |
Source: KCRAR / Heartland MLS, Local Market Update for Jackson, MO, October 2026. Report current as of November 7, 2026. See the Jackson County, MO housing market page and our guides to Lee’s Summit, Blue Springs, Independence, Grain Valley, Greenwood, Raytown and Kansas City, MO.
Johnson County, KS Housing Market – October 2026
Johnson County, Kansas, is still the tightest of the five counties we track, with only 2.3 months of supply and sellers receiving 99.1% of their original list price. The average sales price was $569,817, down 3.3% from last October, and closed sales fell 14.4% to 736. For buyers in Overland Park, Olathe, Lenexa and the rest of the county, there is a little more room to look; for sellers, the market is still competitive when a home is priced right.
| Measure | October 2026 | Change from a year earlier |
|---|---|---|
| Average sales price | $569,817 | -3.3% |
| Median sales price | $452,500 | -2.7% |
| Closed sales | 736 | -14.4% |
| Pending sales | 630 | -19.6% |
| Days on market | 34 | -5.6% |
| Total inventory | 1,849 | +2.2% |
| Months supply | 2.3 | -4.2% |
| Percentage of original price received | 99.1% | 0.0% |
Source: KCRAR / Heartland MLS, Local Market Update for Johnson, KS, October 2026. Report current as of November 7, 2026. This is not the same market as Johnson County, Missouri. See the Johnson County, KS housing market page and our Overland Park & Johnson County guide.
Cass County, MO Housing Market – October 2026
Cass County’s average sales price was $435,833 in October, up a modest 0.7%, but the median told a different story: $323,750, down 8.0% from a year earlier. A few higher-priced sales can pull the average up while typical homes sell for less, so we always look at both numbers with our clients in Raymore, Peculiar and south Lee’s Summit. Inventory jumped 25.1% to 499 homes and supply rose to 3.4 months, so buyers here have more to choose from than they did last fall.
| Measure | October 2026 | Change from a year earlier |
|---|---|---|
| Average sales price | $435,833 | +0.7% |
| Median sales price | $323,750 | -8.0% |
| Closed sales | 140 | -6.0% |
| Pending sales | 103 | -25.4% |
| Days on market | 53 | +12.8% |
| Total inventory | 499 | +25.1% |
| Months supply | 3.4 | +25.9% |
| Percentage of original price received | 96.4% | -0.6% |
Source: KCRAR / Heartland MLS, Local Market Update for Cass, MO, October 2026. Report current as of November 7, 2026. See the Cass County, MO housing market page and our Raymore guide. Lee’s Summit is mostly in Jackson County, with a portion in Cass County.
Clay County, MO Housing Market – October 2026
Clay County, on the Northland side of the metro, had 288 closed sales in October, down 11.4%, and the average sales price eased 2.2% to $375,061. Days on market actually improved to 34, inventory was down 7.3%, and supply tightened to 2.2 months — still a seller-leaning market. Pending sales were down 24.7%, which is worth watching as we head into winter.
| Measure | October 2026 | Change from a year earlier |
|---|---|---|
| Average sales price | $375,061 | -2.2% |
| Median sales price | $331,500 | -1.3% |
| Closed sales | 288 | -11.4% |
| Pending sales | 247 | -24.7% |
| Days on market | 34 | -5.6% |
| Total inventory | 754 | -7.3% |
| Months supply | 2.2 | -12.0% |
| Percentage of original price received | 98.1% | 0.0% |
Source: KCRAR / Heartland MLS, Local Market Update for Clay, MO, October 2026. Report current as of November 7, 2026. See the Clay County, MO housing market page. We help buyers and sellers in Liberty, Gladstone, North Kansas City and the rest of the Northland.
Johnson County, MO (Warrensburg) Housing Market – October 2026
Johnson County, Missouri — including Warrensburg — is a smaller market, with 60 closed sales in October, up from 47 a year earlier. Because the sample is small, that 27.7% jump can look more dramatic than it feels on the ground, which is why we also watch the year-to-date figures (649 closings, up 0.6%). The average sales price was $358,278 and the median was $347,950, both up from last year, with 3.1 months of supply.
| Measure | October 2026 | Change from a year earlier |
|---|---|---|
| Average sales price | $358,278 | +6.2% |
| Median sales price | $347,950 | +12.2% |
| Closed sales | 60 | +27.7% |
| Pending sales | 49 | -10.9% |
| Days on market | 54 | -3.6% |
| Total inventory | 195 | -9.7% |
| Months supply | 3.1 | -13.9% |
| Percentage of original price received | 96.2% | +1.6% |
Source: KCRAR / Heartland MLS, Local Market Update for Johnson, MO, October 2026. Report current as of November 7, 2026. This is not the same market as Johnson County, Kansas. See the Johnson County, MO (Warrensburg) housing market page.
What this means for you
- If you’re selling: Pricing and condition still decide how fast you sell. Ask us for a free, local look at what homes like yours have sold for, because a metro-wide average can look very different from your neighborhood.
- If you’re buying: With a bit more to choose from and fewer buyers going under contract, it is a good time to get your financing and wish list lined up so you can move when the right home comes up.
Want numbers for your street or your suburb? Find out what your home is worth or tell us what you’re looking for, and we’ll put together the local picture for you.
Metro data from KCRAR / Heartland MLS (kcrar.com/stats and the October 2026 Local Market Update). County data from the dated Local Market Updates linked in each section above, current as of November 7, 2026. Year-over-year changes are as reported by the source. Figures do not account for sale concessions and/or downpayment assistance.
Frequently asked questions
What was the average home price in Kansas City in October 2026?
The average sales price in the Greater Kansas City area was $394,762 in October 2026, down 0.9% from a year earlier, according to KCRAR and Heartland MLS.
How long did homes take to sell in Kansas City in October 2026?
Homes spent 43 days on the market in the Greater Kansas City area in October 2026, per KCRAR and Heartland MLS.
What was the housing market like in Jackson County, MO in October 2026?
In Jackson County, Missouri, the average sales price was $342,042 (up 4.3% from a year earlier) and the median was $290,000 (up 5.5%). There were 738 closed sales, and the market had 3.1 months of supply, per KCRAR and Heartland MLS.
What was the average home price in Johnson County, Kansas in October 2026?
In Johnson County, Kansas, the average sales price was $569,817 in October 2026, down 3.3% from a year earlier. The median was $452,500, and the county had 2.3 months of supply, according to KCRAR and Heartland MLS.
How did Cass County, MO home prices compare to the median in October 2026?
Cass County's average sales price was $435,833, up 0.7%, but the median sales price was $323,750, down 8.0% from a year earlier. A few higher-priced sales can pull the average up while typical homes sell for less. There were 140 closed sales and 3.4 months of supply, per KCRAR and Heartland MLS.
What about Clay County, MO and Johnson County, MO (Warrensburg) in October 2026?
In Clay County, Missouri, the average sales price was $375,061 (down 2.2%) with 288 closed sales and 2.2 months of supply. In Johnson County, Missouri — including Warrensburg — the average was $358,278 (up 6.2%) with 60 closed sales. That is a smaller sample, so monthly percent changes can look large. Figures are from KCRAR and Heartland MLS.